eZ Publish Performance Optimization Part 2 of 3: Identifying Trouble Spots by Debugging
The third and final article will provide practical solutions for optimizing performance.
If your actual performance (from your benchmarking tests) does not meet your requirements, you should finetune your eZ Publish installation. Recall the different components of page load time, such as page generation and transfer time. Here, we will take a look at how you can identify the causes of slow website performance, focusing on eZ Publish settings that affect page generation times.
Debug output
Debug output is a built-in mechanism in eZ Publish that provides detailed information for troubleshooting. Debug output provides valuable information about timings, SQL queries, template processing and more. You can enable debug output from within the Administration Interface (in the Common INI settings in the Setup tab) or by adding the following line in your site.ini.append.php file:
[DebugSettings]
DebugOutput=enabled
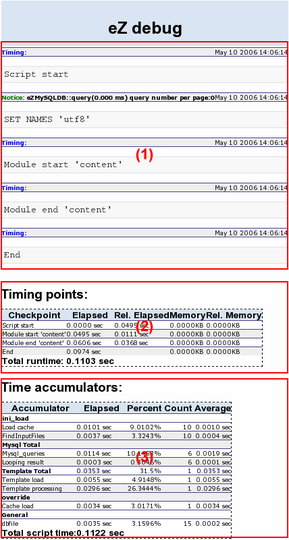
Debug output main area (1)
This section displays errors, warnings, notices and other important information from the eZ Publish kernel, modules, extensions and so on. This section also displays SQL queries when SQLOutput is enabled. Debug settings such as SQLOutput are described later in this article.
Debug output timing points (2)
This section displays timings and the amount of memory spent on processing modules or template blocks. PHP must be compiled with the --enable-memory-limit option in order to be able to show the amount of used memory. This section also displays timing points and accumulated time in your templates. These functions are described below, and are used to test the performance of your template code.
Adding timing points in the templates
You can manually add timing points to eZ Publish templates. This is useful to see how much time specific parts of complex templates take to process.
The example below demonstrates how the debug-timing-point mechanism can be used to measure the time it takes to fetch and print the names of all nodes that are below node number 2.
{debug-timing-point id='test'}

{def $nodes=fetch( 'content', 'tree', hash( 'parent_node_id', 2 ) )}

{foreach( $nodes as $node )}
{$node.name|wash()}
{/foreach}

{/debug-timing-point}
Here is the sample debug ouput for the timing points:
The timing points section of debug output
One thing to note here is that the last and second-to-last times in the timing points are usually different. The second-to-last point, labelled "End", shows the total processing time. The "Total runtime" also includes the flushing of the output buffer, which means that the content has been sent to the browser. If you have a slow connection, there will be a larger difference between these numbers.
Timing points in PHP
When you are developing eZ Publish extensions in PHP, you often need to find how much time the different parts of your code take to process. Timing points can be added with the method addTimingPoint in the eZDebug class. This enables you to track different parts in the code and display the time spent between the different points in the debug output.
PHP code example:
eZDebug::addTimingPoint( "My module start processing" );
...
...
eZDebug::addTimingPoint( "My module end processing" );
Debug output time accumulators (3)
This section of the debug output displays timing information about various parts of the system, such as template processing, character set conversions, XML processing and information about SQL queries. This section also displays the results from the debug-accumulator template function.
Accumulated time with debug-accumulator
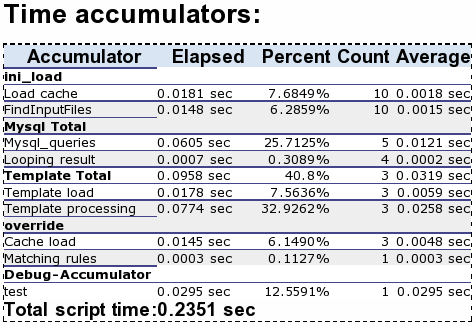
If you have groups of tasks that span several templates and you want to measure the total time spent on the tasks, you can use the time accumulator functions. All time accumulated with the same ID is shown in the same summary in the debug output.
This example demonstrates how the debug-accumulator mechanism can be used to generate debug statistics based on the encapsulated template code.
{debug-accumulator id='test'}
{def $nodes=fetch( 'content', 'tree', hash( 'parent_node_id', 2 ) )}

{foreach( $nodes as $node )}
   {$node.name|wash()}

{/foreach}
{/debug-accumulator}
The time accumulators section of debug output
Accumulators in PHP
When you have repeating code in your extensions, you can add an accumulator to summarize the time spent on the specific code. The example below shows how you can add an accumulator around a MySQL string conversion. This will be summarized in the group mysql_total in the debug output with the label "String conversion in MySQL".
PHP code example:
eZDebug::accumulatorStart('mysql_conversion', 'mysql_total', 'String conversion in MySQL');
...
...
eZDebug::accumulatorStop('mysql_conversion');
eZ Publish's site.ini.append.php configuration file contains some useful debug settings to customize the debug output's behavior:
SQLOutput
- Block: [DatabaseSettings]
- Description: When SQLOutput is enabled, eZ debug output displays the SQL queries used in processing the current view.
QueryAnalysisOutput
- Block: [DatabaseSettings]
- Description: This controls whether the queries should be analyzed for the debug output. It requires SQLOutput to be enabled. This setting is used as a way to obtain information about how MySQL executes a SELECT statement. It is useful for identifying slow queries.
Note: Currently this only works for MySQL, and not other types of database such as Oracle.
SlowQueriesOutput
- Block: [DatabaseSettings]
- Description: When this setting is larger than 0, queries are only shown in SQLOutput if the execution time takes more than the specified number of milliseconds. It is useful for identifying slow queries.
DebugByIP
- Block: [DebugSettings]
- Description: This setting controls whether the debug output is shown only to certain IP addresses. If enabled, it uses DebugIPList to determine which IPs are shown the debug output. IP ranges can be used in addition to individual IPs. This setting is very useful on "live" sites where you don't want every user to see the debug output.
DebugByUser
- Block: [DebugSettings]
- Description: This setting controls whether the debug output is shown only to certain users, similar to DebugByIP. If enabled, it uses DebugUserIDList to determine which users are shown the debug output. DebugUserIDList is an array of UserIDs.
Debug
- Block: [TemplateSettings]
- Description: When this setting is enabled, the debug output shows which template files are loaded. This option is useful when used in conjunction with the ShowXHTMLCode setting.
ShowXHTMLCode
- Block: [TemplateSettings]
- Description: If enabled, the template names are displayed as shown below.
The Administration Interface with ShowXHTMLCode and Debug enabled
When ShowXHTMLCode is set to disabled and Debug is enabled, the template names appear as XHTML comments, which can still be viewed in the page source code as shown below:
<!-- START: including template: design/standard/templates/page_head.tpl (design/standard/templates/page_head.tpl) -->
ShowUsedTemplates
- Block: [TemplateSettings]
- Description: When Debug and ShowUsedTemplates are enabled, the debug output shows a list of all templates used to render the current view.
DebugRedirection
- Block: [DebugSettings]
- Description: If DebugRedirection is enabled, whenever an internal page redirection occurs within eZ Publish, a redirection page with the debug output is displayed. This is especially useful for debugging workflows for custom extensions.
AlwaysLog
- Block: [DebugSettings]
- Description: By default, only major errors are stored in the error.log file under the path/to/ez_publish/var/log/ directory. You can specify which debug types to log with the AlwaysLog setting. error is the default value; warning, debug and notice are the other available values, in decreasing order of debug message severity. Using notice will log general notices and can fill up the log files quickly.
This section contains information on typical scenarios that can cause performance problems. We will describe how to spot and solve them.
Wrong character sets
When character sets are wrongly configured, eZ Publish will use charset conversion as shown in the picture below. This is not necessary and reduces performance:
An example time breakdown for charset conversion
The following example presents an incorrect charset configuration:
i18n.ini.append.php:
[CharsetSettings]
Charset=utf-8
template.ini.append.php
[CharsetSettings]
DefaultTemplateCharset=iso-8859-1
You can define character sets in three places: the database, internally and in templates. In this example, the databases and templates are using the latin1 charset, but the internal charset is set to Unicode. To remedy this problem, ensure that all the character sets used in eZ Publish are the same.
Disabled template compilation
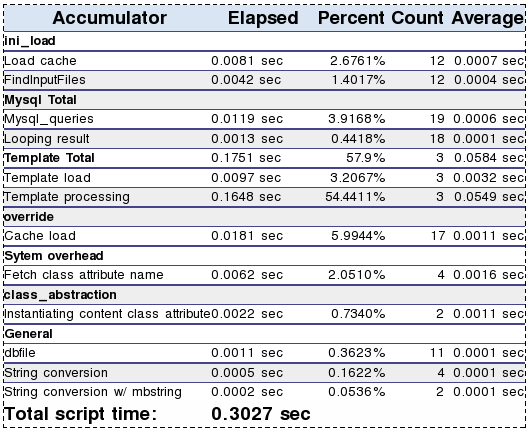
When template compilation is disabled, eZ Publish parses all templates "on the fly". This is helpful during development when you are testing template changes frequently, but it takes a lot of server resources and significantly reduces performance. A common mistake is to forget to enable template compilation when transitioning to a "live" site. The example debug output below shows the template processing times when compilation is disabled.
You can see that time is spent parsing the text and constructing the internal template execution tree before the template is actually processed. This is not necessary.
To fix this, simply enable template compilation:
site.ini.append.php:
[TemplateSettings]
TemplateCompile=enabled
Disabled viewcache
Viewcache is the terminology we use for the cache that stores the complete HTML output of a view. This is similar to template compilation in that it avoids the complete regeneration of a view each time it is accessed. If a development site goes "live" with viewcaching disabled, this reduces performance and increases page load times. Live sites should always have viewcaching enabled.
Here is an example debug output when viewcache is disabled:
Example processing times with viewcache disabled
To fix this, simply enable viewcaching:
site.ini.append.php:
[ContentSettings]
ViewCaching=enabled
Incorrect folder permissions
If eZ Publish is installed on a Linux/UNIX-based system, some of the file permissions need to be changed. The most common issue is that the webserver does not have write access to the settings/, design/ and var/ directories. In this case, eZ Publish will report an error as shown in the picture below:
eZ Publish is bundled with a script called modfix.sh that sets the correct permissions. The script needs to be run from within the eZ Publish base directory:
$ cd /path/to/ez_publish
$ bin/modfix.sh
The modfix script recursively alters the permission settings of the following directories:
var/*
settings/*
design/*
You can also set these permissions manually. If you know the user and group of the webserver, it is recommended to use a different set of permissions. This is more secure, as it only allows write access for the webserver user and group.
$ chmod og+rwx -R var

$ chown -R example:example var
The "example:example" notation must be changed to the user and group of the webserver.
Slow database
The time spent accessing the database in eZ Publish is usually low (1-20% of the total page generation time, depending on how complex a given page is). If you disable viewcaching and look at the debug output, you can see how much time is spent on the database connection. Either the connection to the database or the database itself might be running slowly.
Here is some sample debug output on database timing:
Here is a slow SQL query (with SQLOutput enabled):
Many SQL queries
Redundant usage of the fetch function can produce a lot of unnecessary SQL queries. This reduces performance and wastes server resources. By using the debug output with disabled viewcaching, you can see how many SQL queries are performed. Below we present example template syntax used to fetch children and sub-children from a folder:
{foreach fetch(content, list,hash(parent_node_id, 2)) as $object}
   {def $sub_children=fetch( content, list, hash( parent_node_id, $object.node_id ) )}
  Child name: {$object.name}<br/>
   {foreach $sub_children as $sub_child}
       Sub-child name: {$sub_child.name}<br />
   {/foreach}
{/foreach}
This code produces a lot of unnecessary SQL queries and can be replaced with:
{foreach fetch(content, list,hash(parent_node_id, 2)) as $object}

  Child name: {$object.name}<br />
  {foreach $object.children as $sub_child}
      Sub-child name: {$sub_child.name}<br />
  {/foreach}
{/foreach}
Here is an example debug output with a large number of SQL queries:
In this article, we have outlined the features of eZ Publish's debug output. Functions such as timing points and accumulators, along with a number of debug settings, can help to reveal problem areas related to site performance. We welcome your comments and tips regarding eZ Publish performance and debug settings.
In the final article in this three-part series, we will build on the benchmarking and debug output knowledge that you have gained to describe concrete solutions to improve your eZ Publish site's performance.


